“What does my 3DMark score mean for real-world game performance?”
3DMark has always taken a game-like approach to benchmarking, but, in the past, it’s been hard for gamers to make the connection between 3DMark scores and game frame rates.
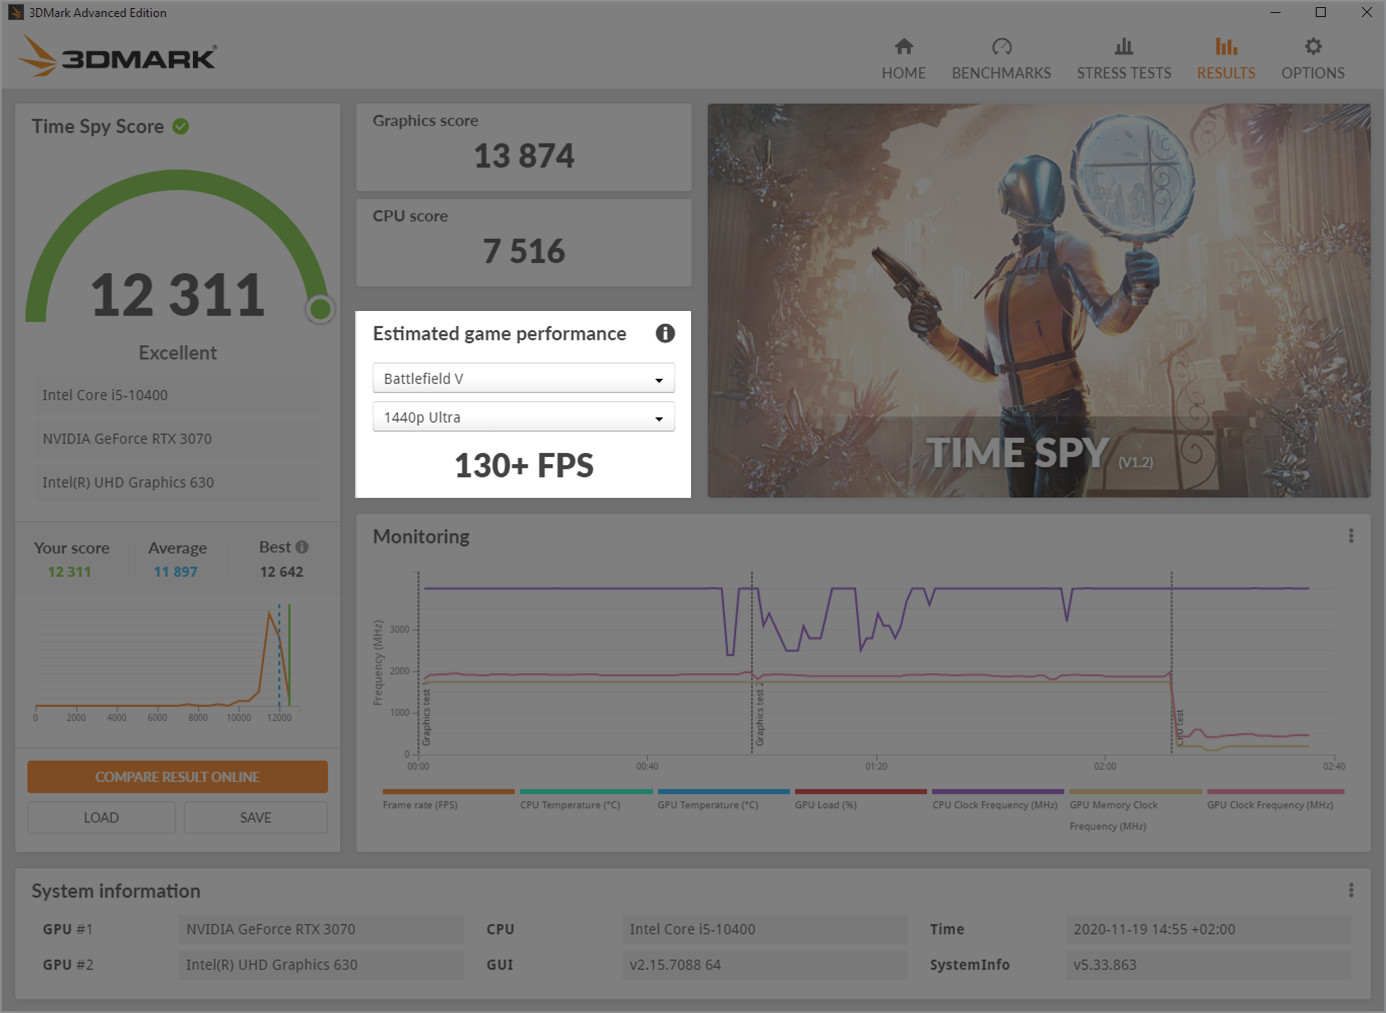
In November 2020, we added a new feature to the 3DMark results screen that shows you the frame rates you can expect in a selection of popular games.
These game performance estimates are powered by extensive data from our in-house testing. This page explains how we estimate game performance from 3DMark benchmark scores.
Estimated game performance in 3DMark
3DMark estimates game performance from your benchmark score. In the current release, you can choose from five popular games. For each game, you can choose either 1080p Ultra or 1440p Ultra settings. Ultra means using the game’s highest visual quality settings. Ray tracing options, if available, are turned off.
How accurate are the game performance estimates?
3DMark shows the average frame rate you can expect in the selected game. The frame rate is an estimate rather than an exact guarantee of performance.
Frame rate estimates, in frames per second (FPS), are rounded down to the nearest multiple of five, e.g. 60+, 65+, 70+, 75+, etc.
Frame rates can vary within a game depending on the level or mode. Player actions, especially in multi-player games, can result in frame rate variance.
Game updates, driver updates and system updates may also affect performance. We retest games and rebuild our models when an update significantly affects performance. Please note that there can be noticeable performance differences between versions of a game.
You may see small differences in frame rate estimates from different benchmarks on the same system. For example, the frame rates estimates from a Time Spy score may not exactly match the estimates from a Fire Strike score.
PC performance testing at UL
UL works with consumer electronics retailers to test and categorize PCs of all types. We are currently working with more than 25 major retailers worldwide including Currys PC World, CyberPowerPC, Dell, Elkjøp, iBuyPower and Lenovo.
Every year, UL tests hundreds of PC systems for its retail partners. We test the performance of each system with a selection of benchmarks and popular games.
This comprehensive performance data enables us to accurately model the relationship between 3DMark scores and game frame rates.
The game testing process
We conduct game testing on a wide selection of gaming hardware that covers the range of popular CPUs and GPUs found in modern gaming PCs.
We test each game at 1080p and 1440p resolution using the game’s highest visual quality settings. This means either choosing the maximum fidelity preset or manually turning all the graphics settings to the highest level. Ray tracing options, if available, are disabled to ensure consistent estimates across all hardware from entry-level to the high-end.
Each game is tested using either a built-in benchmark, if available, or a live gameplay scenario. Our game testing experts determine a suitable gameplay scenario for each game. A good scenario covers common gameplay, is reasonably demanding, and is easy to reproduce and repeat on other systems. The length of the test scenario varies by game. The minimum duration is three minutes.
The gameplay scenario is repeated on all systems. Frame rate data is collected during the test and checked for consistency between systems.
Game performance estimation process
We use the game testing data to identify the components that determine game performance at each resolution and settings level.
For 3DMark, we focus on games that are GPU-bound. This means that the frame rate in the game depends only on GPU performance. This makes the data easier to understand and model when relating benchmark scores to game performance.
The chart below shows the relationship between 3DMark Time Spy Graphics score and average frame rate in Fortnite. Each orange dot shows the performance of a different system tested by UL.

You can see from the chart that a PC that scores 4,000 in the 3DMark Time Spy Graphics test can run Fortnite at 50 FPS on average at 1440p with the highest graphics quality settings. A 3DMark score of 6,000 translates to an average of 70 FPS in Fortnite. A score of 12,000 translates to 140 FPS.
The charts below show the correlation between 3DMark Time Spy Graphics score and average frame rate in Apex Legends and Red Dead Redemption 2.
It’s these correlations that enable 3DMark to estimate game frame rates.


We check the correlation between game performance and benchmark scores for each combination of resolution and visual quality settings separately. Any anomalous results are retested before they are used in statistical modeling.
Estimating game performance for multi-GPU systems
For games that support AMD CrossFire or NVIDIA SLI, game performance scaling with multi-GPU systems is tested, checked and modeled separately. After benchmarking a multi-GPU system, the game performance estimates on the 3DMark result screen will reflect the use of multi-GPU, if supported by the game.
Most games do not benefit from having a second GPU in the system. If a game does not support multi-GPU, the performance estimate is based on the equivalent single-GPU system.
How can I see frame rate estimates for other games?
We plan to update the game list several times a year. You can expect to see a mix of best-selling games and popular new releases, especially those that have demanding system requirements.